In the near future the job profile of operations and DevOps will again change dramatically. DevOps practices, cloud, and container platforms allow for automation like we’ve never seen before. Does that mean that operations people will run out of jobs? Quite the contrary, the field of work will change, grow, and evolve around a few key principles that will be introduced throughout this article.
Today, in most companies it is common to have a handful of people sitting in front of one or more screens, staring at dashboards all day, everyday. That’s not the most satisfying and fulfilling job description now, is it? Imagine a world, where no one needs to watch charts and graphs on dashboards and how they change over time, just to alert a lot of people that in turn have to gather intel to find out what has happened and why, to in turn alert another group of people that then have to fix the mess. That approach is expensive, complex, and definitely not state-of-the-art anymore. Here is what you can do to empty your NOC and get a fresh perspective on the future work of operations.
DevOps at its best
The ultimate goal of DevOps is, was, and always will be minimizing the time it takes from having an idea of a new feature, implementing that idea, making sure the code changes don’t break anything, providing the feature to the customers and measure its adoption. We’ve come a long way to have finally developers and people from operations work side by side towards common goals, that are quality and speed. Not so long ago, many of the steps necessary to push a new feature through to production were done by hand. Automating tests, builds, and configuration was a step in the right direction to accelerate that process by using code for supporting operational tasks. It’s all about getting rid of manual tedious tasks that barely anyone likes to do for the umpteenth time.
Cloud and container platforms are built to allow for automation and easier development and deployment of applications. However, these platforms also introduce another level of complexity from an operational standpoint. For example, what used to be an in-memory function call to another class in the same JVM is now a remote call to a separate microservice that traverses an arbitrary number of physical and virtual network components. We found that nowadays a single transaction on average uses more than 80 different types of technology.
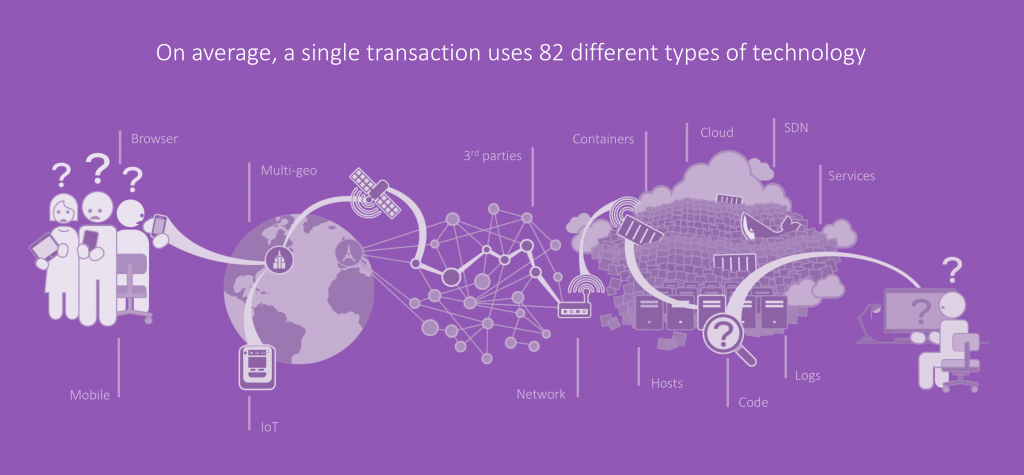
Figure 1: Complexity of end-to-end transactions
Going beyond DevOps – what does that even mean?
Extending the DevOps approach to areas that are still owned exclusively by operations people, like monitoring and executing actions based on the monitoring data. In order to achieve that, we found that the following steps lead you to the pinnacle of DevOps, where almost all manual tasks have been automated. This might not be 100% true for all applications and all use cases, but at least it gives you an idea of what the right level of automation could do for you.
Good idea, but we don’t have time for that
With agile software development approaches and microservices architectures, every team can choose the programming language they want to implement their service with. While the implementation language is arbitrary, it’s a good recommendation to prescribe the operational tools that have to be used, like for example CI server, artefact repository, load testing tool, and monitoring tool. Having a common toolset makes it easier to change between teams and more importantly reduces the number of people needed to operate and maintain all the tools, and you need people to have time to work on achieving the next level of DevOps.
What we’ve learned from experience matches what research tells us – enterprises tend to have a lot of tools in place that basically do the same job, just slightly different and maybe in a different context. A straightforward way to free up people for driving the change is to analyze and consolidate the tool landscape. Since the ultimate goal is executing operational tasks triggered by monitoring data of the applications, the monitoring tool is a suitable candidate for consolidation.
Eventually, you need to have people that have the know-how and resources to increase the level of automation throughout your software development life cycle. Those people need to be domain experts and also need to embrace cloud and container platforms, which brings us to the next step.
Pack your things, we’re moving to the cloud
In order to take advantage of all benefits that automation brings to the table, you need to be able to operate your application environment in an automated way. This is almost impossible in an environment with only physical machines. If you need to add one more node in such a setup, you need to get your purchase order approved and sent, wait until the new hardware is shipped and set up properly. By the time the new node is operational, your environment and requirements could have changed and the new node might not be needed anymore after all.
Cloud platforms allow for spinning up new instances in seconds. Container platforms allow for spinning up additional application components in seconds, while taking care of load balancing and setting up the necessary routing and firewall rules on the fly. Moving or migrating applications to cloud and container platforms is mandatory for increasing the level of automation.
Migrating existing applications to the cloud is non-trivial. Lifting and shifting an application to a public cloud doesn’t make your app ready to go for automation. An app is not cloud-native by default, just because it’s hosted in the cloud. It just runs on someone else’s computer that you can’t control and that might not even be exclusively used by your app but also others.
An alternative route to migrating, is refactoring a monolithic application to a microservices architecture and placing those microservices in purpose built offerings of cloud providers. This approach takes quite some time, requires a lot of experience in software development and architecture, and locks you in on one public cloud vendor. As a third option, companies tend to write new parts of an application in a microservices architecture and connect those microservices to the monolithic application.
The ultimate goal is to have microservices, to on the one hand be able to develop different parts of an application independent from other parts, and to push small incremental changes from development to production as fast as possible, without rebuilding the entire application.
However, microservices, containers, and cloud platforms introduce a whole new level of operational complexity. Each additional platform and each additional framework that is used to implement, test, or deploy the application adds additional sources for possible errors. The number of available platforms and framework is vast and are growing by the day. Thus, the prescription of certain operational tools along the delivery pipeline makes even more sense, because one tool for one job makes the entire system less susceptible to errors than many different tools do.
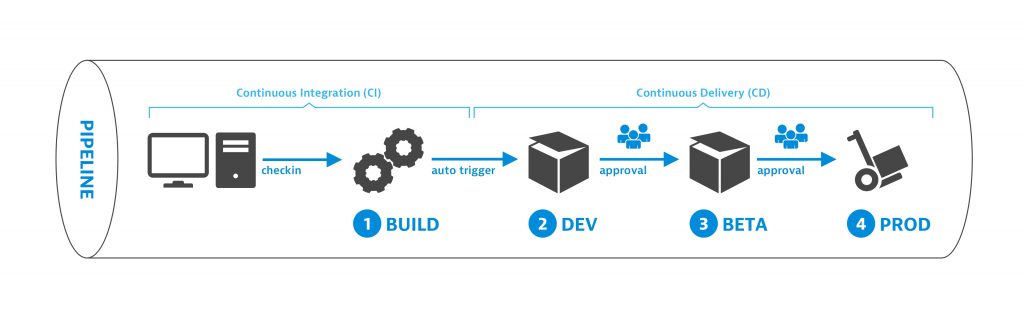
Figure 2: CI/CD Pipeline
Figure 2 shows a typical continuous delivery (CD) pipeline. CD pipelines are a logical consequence of continuous integration (CI) pipelines, that pushes the tested and packaged code artefacts to one or more environments for approval. The manual approval steps, as shown in figure 2, that allow code changes to be pushed to a production environment, need to be replaced by automation.
What are the safety features of your pipeline?
To automate manual approval steps, the concepts of shiftleft and shift-right need to be introduced, so you can create an unbreakable delivery pipeline – another new concept. The term Shift-Left has been used and probably abused just as often as DevOps. Shift-Left means to use more data earlier in the software development lifecycle to answer the key question: “Is this a good or a bad change we try to push towards production?” And if it is bad, don’t push it further down the pipeline. You can rely on unit test results, code quality metrics, and even performance metrics to identify if a change is bad or not. While monitoring data should not be the only data you look at in your pipeline – make sure you look at your code quality metrics – it is one aspect that many have tried to automatically include in the pipeline to automate build validation.
Traditionally Build Validation is done manually by performance engineers that pull up different dashboards of different timeframes and either give their thumbs up or down. Many have automated the generation of these reports but still compare the final reports manually. Shift-Right means to push context information about deployments or changes to the environment that is monitored. The more context we have, the better we can implement Self-Healing in the next steps. You can pass meta data as part of your automated deployment process, e.g. tags from AWS EC2 instances, Docker, Cloud Foundry, OpenShift, Kubernetes, which eliminates the need to re-tag all entities later on.
From this point on a first class monitoring solution is key – a single pane of glass, where all information about your application is at your fingertips and entities can be decorated with additional context information in the form of tags or metadata. The unbreakable pipeline is all about implementing a delivery pipeline that doesn’t let bad code pass. The definition for bad code goes from failing unit tests to worse service performance or higher failure rates of a service as in the previous version. If a code change passes the unbreakable pipeline, you can safely assume that it’s correct from a functional perspective, meets code quality guidelines, and is also validated from a performance perspective. Now we’ve ensured that no bad code is promoted to production. But what if something breaks in production, that wasn’t detected during the build pipeline – who you gonna call?
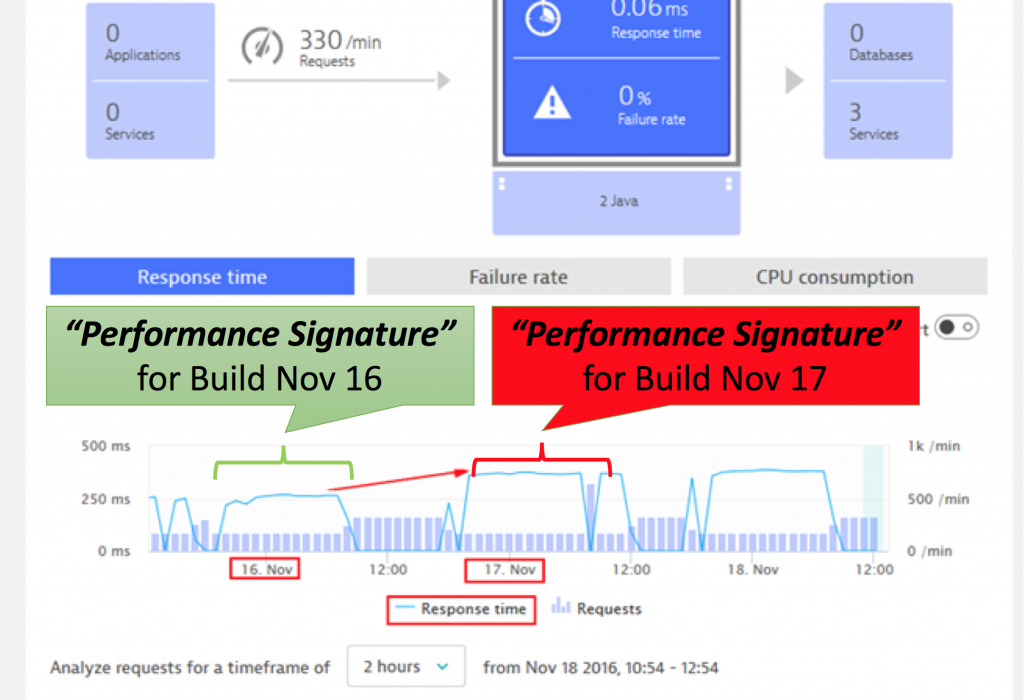
Figure 3: Comparing the performance of different versions
We have a machine for that
No testing in the world guarantees for smooth sailing in production. Therefore, we must think about how to automate remediation actions if something goes wrong in production. In this phase, the monitoring solution again plays a vital role. Every time a problem is detected, it can call either external tools or webhooks with details about the problem. We’ve already pushed context information about deployments, configuration, and environment changes to the monitoring solution. Dynatrace is one of the only tools, that can also take these metadata into account for automatically finding the root cause of a given problem. It is key to know the root cause of a problem to be able to apply the correct remedy. Otherwise, you could just be firefighting symptoms that would not have happened, if it weren’t for the underlying root cause. Depending on the actual root cause and the environment we must take different actions to “heal” the system. Without auto remediation in place, all occuring problems would be escalated to a person on call that then has to take care of fixing that problem. There are common error patterns that have common remediation actions, so we could ask a machine to try to fix the issue, by following similar steps a person would take, given certain problems and root causes, as shown in the figure 3. If the problems have not been resolved by those automated remediation actions, you can try to rollback to the previous version and see if this fixes the problems. If that also doesn’t work, a predefined escalation plan is followed. However, we’re not immediately escalating the problem to people at unholy hours or even the weekend.
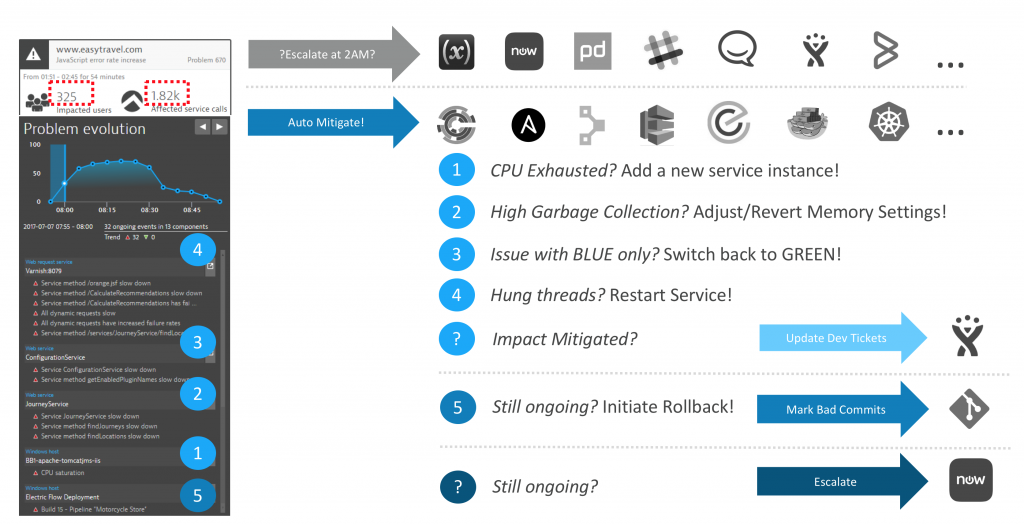
Figure 4: AI Detected Problem details allow us to build smarter automated mitigation actions. No need to wake up engineers at 2AM every time a problem happens.
What’s your plan B?
Let’s assume the remediation, be it manual or automated, takes a few hours and the performance of your web application is affected by the problem, which also entails, that the end users of the application are affected. That means, your users or customers will have to live with a slow web application for quite some time. Now, you can announce it on social media, that you’re terribly sorry for the slowdown and that you’re working on a solution. Alternatively, you could proactively engage with your users and customers and make it up to them by providing discounts during the period your service is slower that it usually is. Figure 5 shows an example for that. Your application could react to an event sent by a monitoring solution and display a dark page with a 10% voucher for all users that are visiting during the performance degradation.

Dark page with voucher
A different approach, that is quite popular, is opening a chat window that is operated by a chatbot behind the scenes, and inform the user about your business mitigation actions using that, as you can see in figure 6. Ultimately, you should be proactive when your application has performance problem that have an effect on the user experience. With a smart monitoring solution like Dynatrace, you could identify your application is only slow for a certain geo region, a certain browser version, or a certain mobile operating system. You could use this information to only target the business mitigation action on the users that are actually affected, instead of giving away vouchers for no reason.
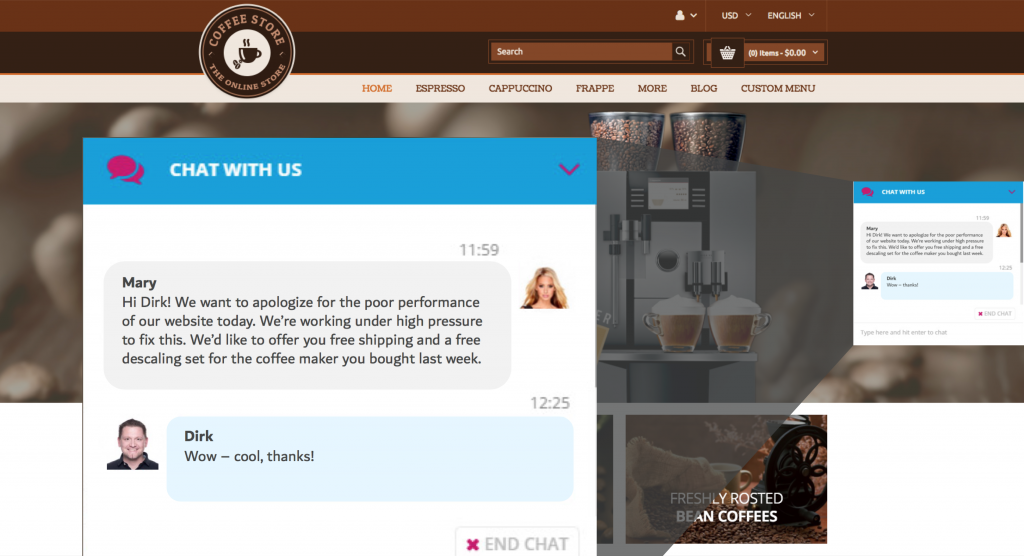
ChatBot
Let’s automate everything!
The ultimate level of DevOps would be to have smart assistants, either chat bots or voice bots, that identify common error patterns out-of-the-box and proactively suggest remediation actions and only ask for your approval to execute those. Most people are not well trained performance engineers, but everybody knows how to ask a question. Smart assistants can forward the request to for example Dynatrace and present the answer within seconds.
Sounds great – where should I start?
While this may sound futuristic and out of reach to many, there are already people and companies implementing that. Here is some guidance that might help you identify where you could start improving your process and adopting automation. How many people do you need to just keep everything running in your application environments? What is your developer and operators ratio? How long does it take to push a new feature from development to production and how many manual steps are involved in that process? You’ve read the story and you’ve learned what is already possible with the tools that are out there. You’ve got a few questions, that could help you define the first goals for process improvements. Your journey towards moving beyond DevOps starts now!
Dirk Wallerstorfer is Director of Innovation Strategy at Dynatrace. He has 15+ years of hands-on experience in networking, security, and software engineering. Dirk’s job is to know everything that is going on around virtualization of infrastructure and application environments. He spends his days on researching new and emerging technologies, profoundly understanding them, and sharing his experiences and findings through blog posts and during his speaking engagements at conferences and meetups around the world. Dirk is from Austria, son of two, husband of one, and father of two.

| Dirk Wallerstorfer
Director Innovation Strategy |